Indonesia
  Português
  Tiếng Việt
  ไทย
ไทย  العربية
  हिन्दी
  简体中文
简体中文  Nederlands
  Français
  Deutsch
  हिन्दी
  Italiano
  한국어
한국어  Melayu
  Norsk bokmål
  Русский
  Español
  Svenska
  Tamil
Tamil  Türkçe
  Zulu
Zulu
MACD is one of the most popular technical indicators used to identify trends of the market price. In this article, I will write about the MACD indicator. It includes how to identify market trends with MACD and develop an IQ Option trading strategy around this indicator.
Register IQ Option and Get Free $10,000 Risk warning: Your capital might be at risk.
What is MACD indicator?
MACD (Moving Average Convergence Divergence) is an indicator formed from the moving average EMA. Therefore, MACD indicator fluctuates according to the price trend. This is an important signal to help traders identify the main trend of the market. Thanks to that, they can take the appropriate action.
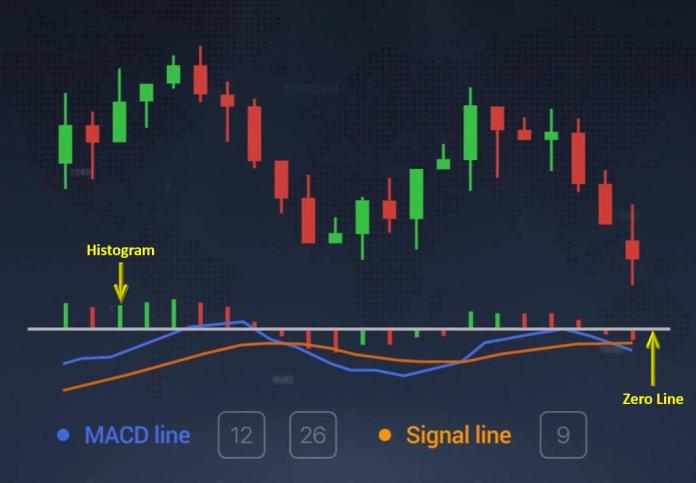
MACD indicator in IQ Option has 4 main parts.
• MACD (blue line) is a combination of EMA12 and EMA26, which shows the price development trend.
• Signal line (orange line) is the EMA9 line used to monitor the trend of the price.
• Histogram column: MACD – Signal line. Used to measure the degree of convergence and divergence between two moving averages. It shows whether the rate of price change at the time of confirmation is fast or slow.
• Zero line (Baseline) is 0 axis. It is to determine the starting point of uptrend or downtrend.
MACD indicator – How does it work?
There are two very important signals of MACD indicator that you must know.
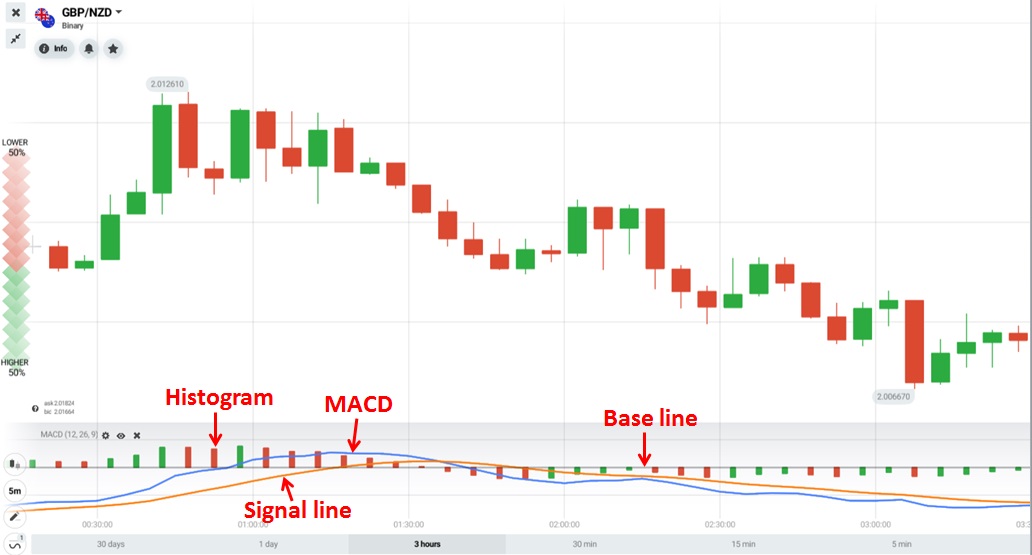
Signal 1: Predicting market trend with MACD
The intersection of MACD land Signal line along with the fluctuation of the Histogram column will help you accurately predict the upcoming trend of the price.
Specific example:
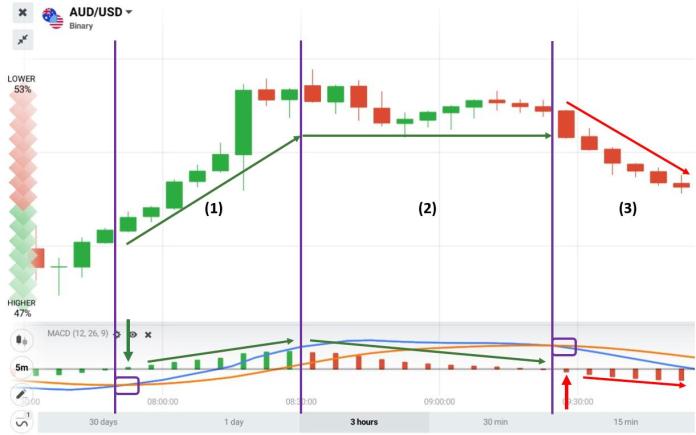
(1) When MACD from the bottom moves up and crosses the Signal line => It signs that the upcoming trend is up. The Histogram columns will lie on the Zero line. When the Histogram increases, the price will increase.
(2) When Histogram declines => It signs the possibility of a market trend reversal.
(3) When MACD from the top goes down and crosses the Signal line => it predicts a downtrend. The History column will be below the Zero line.
Signal 2: Divergence of MACD indicator
MACD divergence is understood as the price increases but MACD decreases. Or vice versa, the price decreases and MACD increases.
When MACD divergence occurs, the probability of a market reversal is very high. Therefore, it becomes an important signal in technical analysis.
Specific example:
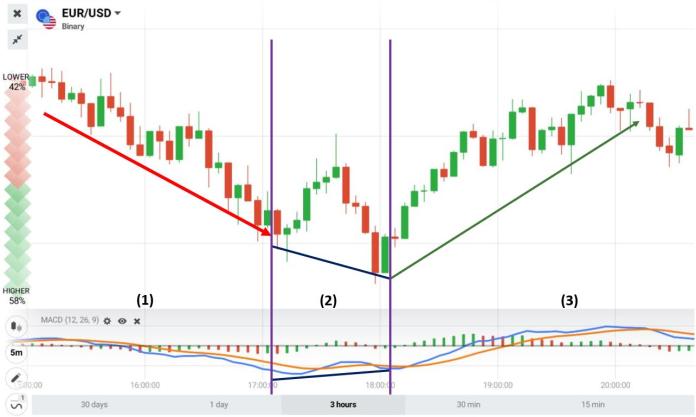
(1) The prices is in a downtrend.
(2) MACD divergence appears (The price decreases but MACD increases).
(3) The market reverses from downtrend to uptrend.
How to trade with MACD indicator in IQ Option
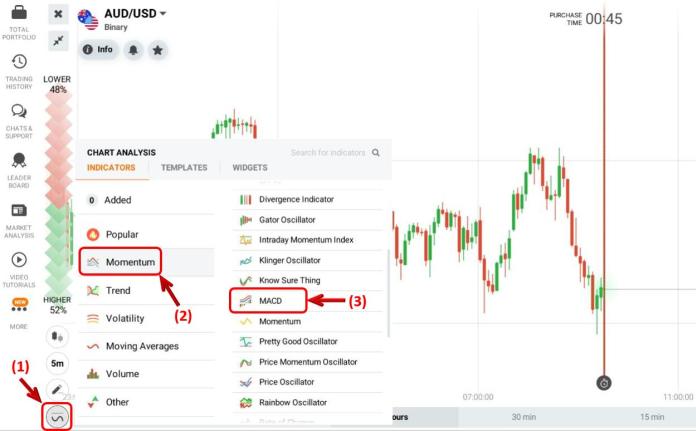
How to set up MACD indicator in IQ Option
If you want to use MACD indicator, (1) Click on the indicator box => (2) Tab Momentum => (3) select MACD.
How to trade in IQ Option with MACD
MACD will be an indicator to identify a trend. By the way, it also gives signals of safe entry points. I will introduce you a few techniques to open options with MACD in IQ Option.
Technique 1: Heiken Ashi candlestick combining with MACD indicator
Requirements: 5-minute Heiken Ashi candlestick chart + MACD indicator. The expiration time is 15 minutes or longer.
Trading technique:
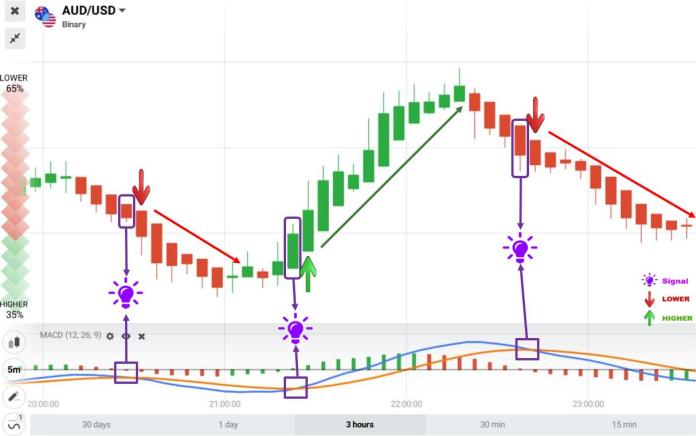
HIGHER = Heiken Ashi candlestick chart is green + MACD from the bottom moves up and cuts the Signal line.
LOWER = Heiken Ashi candlestick chart is red + MACD from the top goes down and cuts the Signal line.
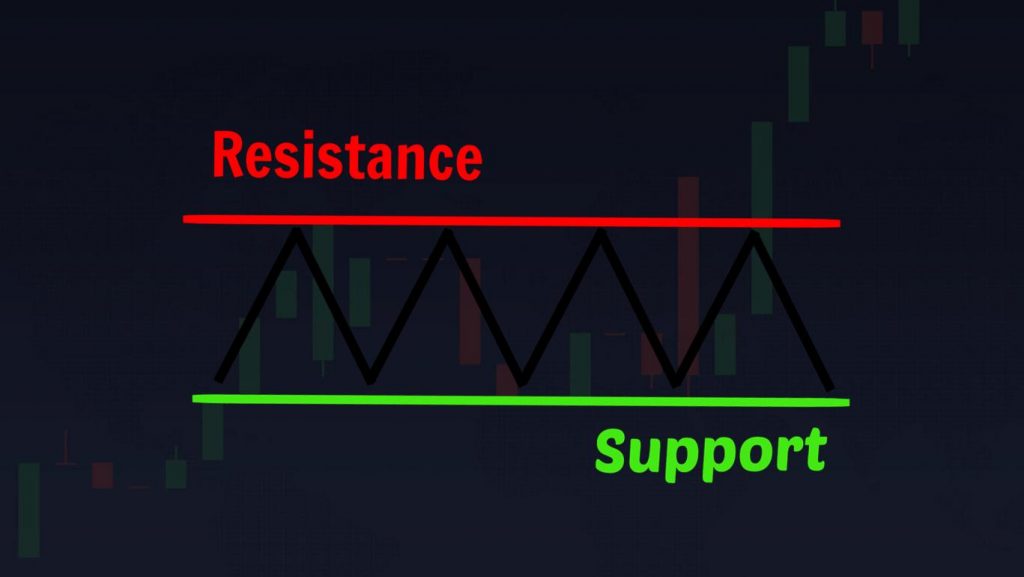
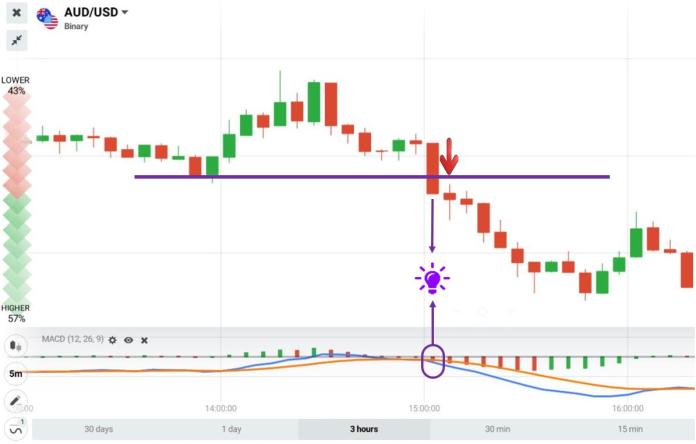
Technique 2: Combine MACD indicator with support and resistance levels
Requirements: Japanese 5-minute candlestick pattern + MACD indicator. The expiration time is 15 minutes or longer.
This is a very effective way to trade in IQ Option – Opening options according to the main trend of the market. The probability of making money is relatively high.
Trading technique:
Open a HIGHER option = The price increases and breaks the resistance level + MACD goes up and cuts the Signal line (the price is rising).
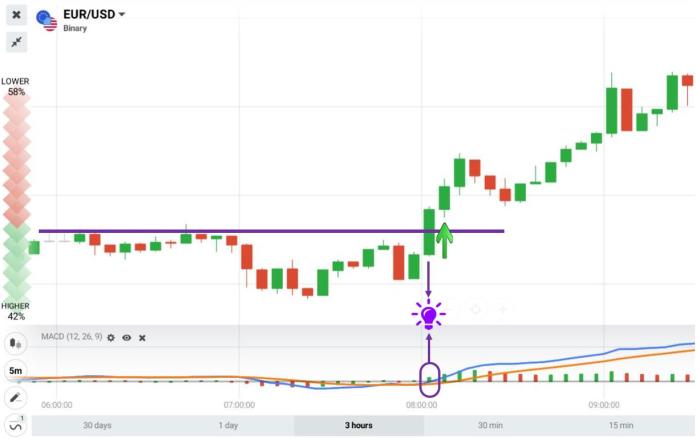
Open a LOWER option = The price falls and breaks the support level + MACD moves down and cuts the Signal line (the price is decreasing).
There are many other effective ways to trade in IQ Option around MACD indicator. We will share more in the next articles.
Love!
Register IQ Option and Get Free $10,000 Risk warning: Your capital might be at risk.
Indonesia Português Tiếng Việt ไทย العربية हिन्दी 简体中文 Nederlands Français Deutsch हिन्दी Italiano 한국어 Melayu Norsk bokmål Русский Español Svenska Tamil Türkçe Zulu