Indonesia
  Português
  Tiếng Việt
  ไทย
ไทย  العربية
  हिन्दी
  简体中文
简体中文  Nederlands
  Français
  Deutsch
  हिन्दी
  Italiano
  한국어
한국어  Melayu
  Norsk bokmål
  Русский
  Español
  Svenska
  Tamil
Tamil  Türkçe
  Zulu
Zulu
The formula to make money in IQ Option is to Identify price trends > Find trading signals and entry points > Patience and rules. And many traders consider SMA as one of the best indicators when trading IQ Option. It confirms the trend of the price as well as creates signals to buy options.
So what is SMA indicator? How does SMA work? How to build an options trading formula in IQ Option? This article will help you answer these questions.
Register IQ Option and Get Free $10,000 Risk warning: Your capital might be at risk.
What is SMA indicator?
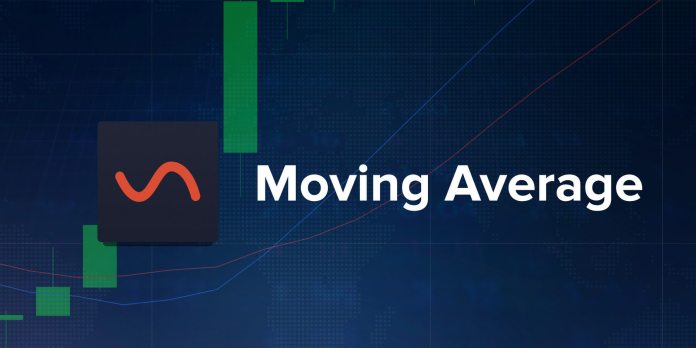
SMA (Simple Moving Average) indicator, also known as MA, is a moving average that shows price movements over time. This is a simple indicator type that is trusted by professional traders. Furthermore, SMA is famous for its reliability in identifying market trends. SMA is calculated by summing the closing prices in an X period and only for X.
For example, in IQ Option, if you draw the moving average SMA14 on a Japanese 5-minute candlestick chart => SMA14 = total closing price of the last 14 candlesticks divided by 14 (Average closing price of 14 nearest candlesticks).
The accuracy of SMA indicator depends on the time period. When the time period is long and there are few signals, the accuracy is high. On the contrary, when the time period is short and there are a lot of signals, the accuracy is low. For instance, below are some common SMA that are most used for market analysis.
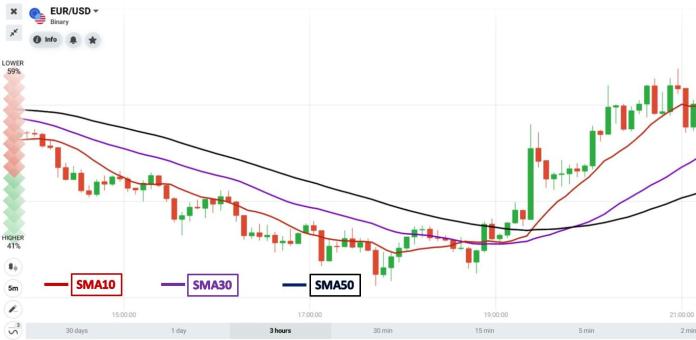
• SMA10: The moving average line of the previous 10 candlesticks. It analyzes short-term fluctuations of the market.
• SMA30: The moving average line of the previous 30 candlesticks. Hence, SMA30 analyzes medium-term fluctuations of the market.
• SMA50: The moving average line of the previous 50 candlesticks. As a result, it analyzes long-term market fluctuations.
How does SMA indicator work?
You can use SMA indicator to identify price trends.
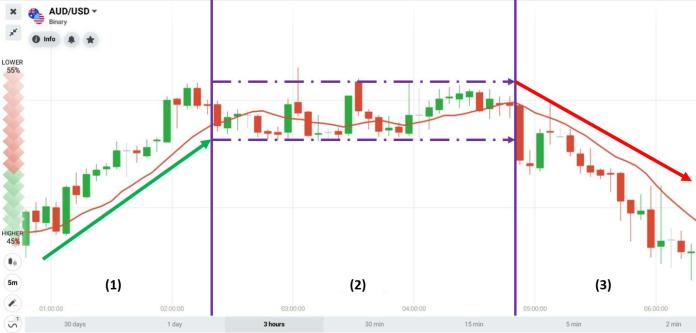
(1) When the price is above SMA => The market tends to increase.
(2) When the price continuously crosses SMA in a certain channel => The market tends to move sideways.
(3) When the price is below SMA => The market tends to decrease.
How to set up SMA indicator in IQ Option
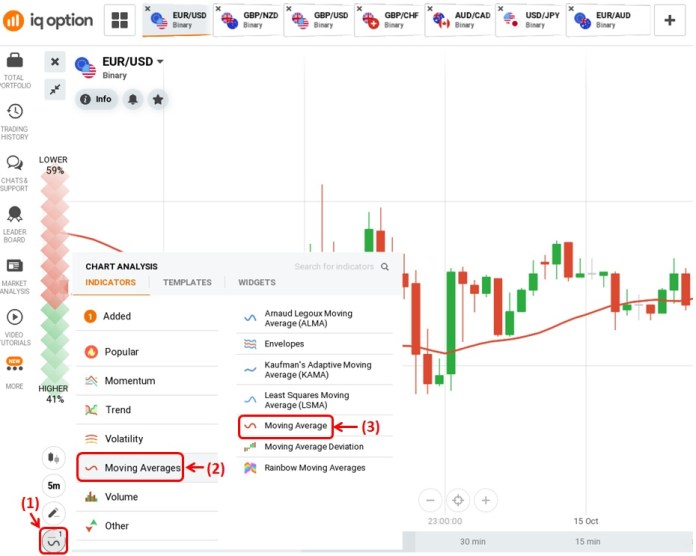
If you want to set up the SMA line, (1) Click the indicator box => (2) Moving Averages Tab => (3) Select the Moving Average.
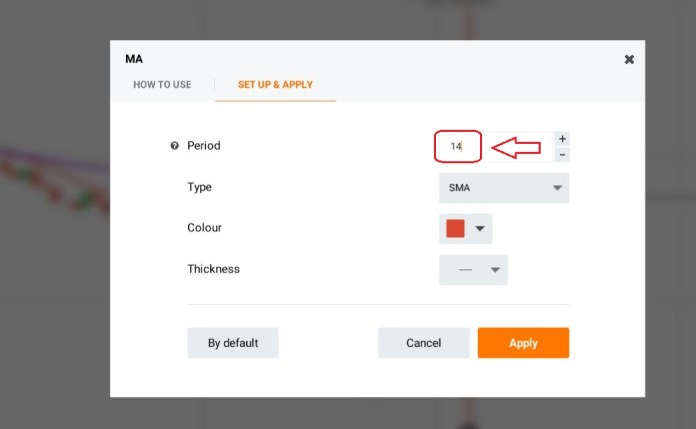
The basic setup of SMA in IQ Option is 14 (average of the closing prices of the previous 14 candlesticks). You can customize this parameter to suit your own IQ Option trading strategies.
How to trade options with SMA indicator in IQ Option
SMA is also considered as the trend line of prices. Therefore, with each market trend, we have different trading techniques.
The meaning of icons in the picture:
• Lamp icon is a signal to open a trade (option).
• The green arrow icon is to open a Higher option when the signal has just ended.
• The red arrow icon is to open a Lower option when the signal has just ended.
Technique 1: SMA indicator works with Heiken Ashi candlestick pattern
Heiken Ashi is a trend candlestick pattern. When combining with SMA trend line, it will give long-time safe entry points.
Requirements: 5-minute Heiken Ashi candlestick pattern + SMA10 indicator. The expiration time is 15 minutes or more.
How to trade:
HIGHER = Heiken Ashi is in the green candlesticks range (uptrend) + The price cuts SMA10 from below the SMA10.
LOWER = Heiken Ashi is in the red candlesticks range (downtrend) + The price cuts SMA10 from above the SMA10.
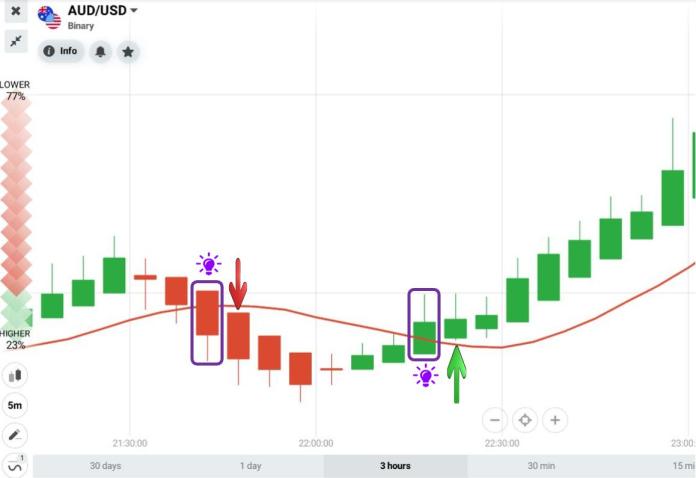
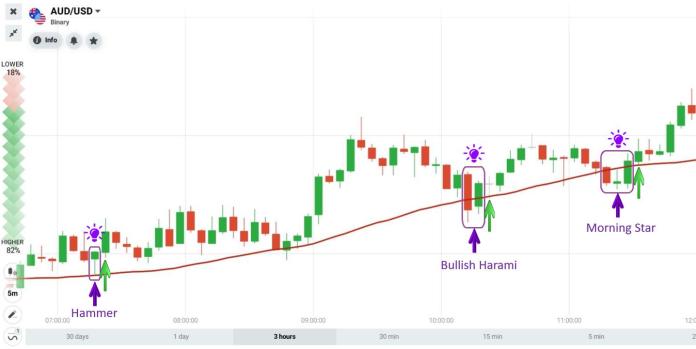
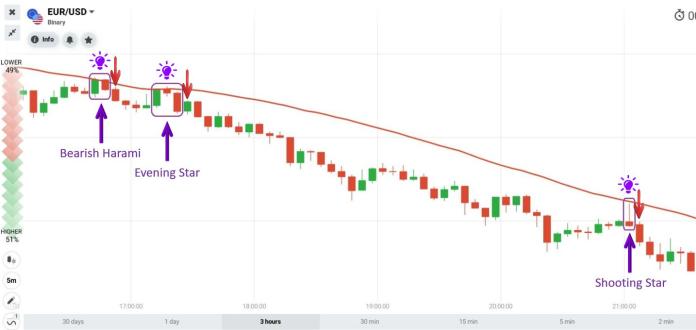
Technique 2: SMA30 works with reversal candlestick patterns
SMA30 indicator is also considered as the medium-term trend line. Thus, we will focus on observing the intersection of price and SMA30. If the market creates reliable candlestick patterns, open short-time options.
Requirements: Japanese 5-minute candlestick pattern + SMA30 indicator. The expiration time is 5 minutes or more.
Trading technique:
HIGHER = The price is above the SMA30 (uptrend) and intersects SMA30 + bullish candlestick pattern (Bullish Harami, Morning Star, Hammer, etc).
LOWER = The price is below the SMA30 (downtrend) and intersects SMA30 + bearish candlestick pattern (Bearish Harami, Evening Star, Shooting Star, etc).
A short video introducing the Moving Average in IQ Option
In conclusion, there are many ways to use SMA to build a safe options trading strategy. We will introduce and do live trade in the strategy articles on this website.
Indonesia Português Tiếng Việt ไทย العربية हिन्दी 简体中文 Nederlands Français Deutsch हिन्दी Italiano 한국어 Melayu Norsk bokmål Русский Español Svenska Tamil Türkçe Zulu